Have you ever caught yourself thinking that an advertising platform knows more about your customer than your product?
No joke. The marketing manager showed a report where demand-side platforms provided a behavioral profile: when a person clicked, what content they encountered, how many times they saw a banner. And in the product? A couple of fragmentary metrics: purchase and dropout. That’s it.
And at that moment, a strange feeling arises: as if someone is keeping a parallel diary of your users, but they’re not showing it to you.
What DSP Sees:
- DSP works like a giant sensor. It records not only the fact of a click, but also the context, which app the user was in, how many times the ad was shown, and how often it worked. It’s like telemetry: dozens of sensors capturing every micro-step.
- Now for the contrast. Product analytics usually looks at “events” within the product: registration, purchase, retention. The entire “journey to the door” is reset to zero.
- The real pain? Marketing knows: “These people respond to a trigger message on the third impression.” But the product doesn’t know: “Sorry, we only see that retention is 20%.”
- The skeptic’s counterargument: “So what, we have GA, Amplitude, Mixpanel.” Yes, they show movement inside your funnel. But only inside. They won’t tell you what behavioral signals led the user to the threshold.
The result? You have not one customer, but two — an advertising customer (according to DSP) and a product customer (according to analytics). And you don’t even know if it’s the same person or not.
When Data Lives In DSP, And The Product Remains Blind
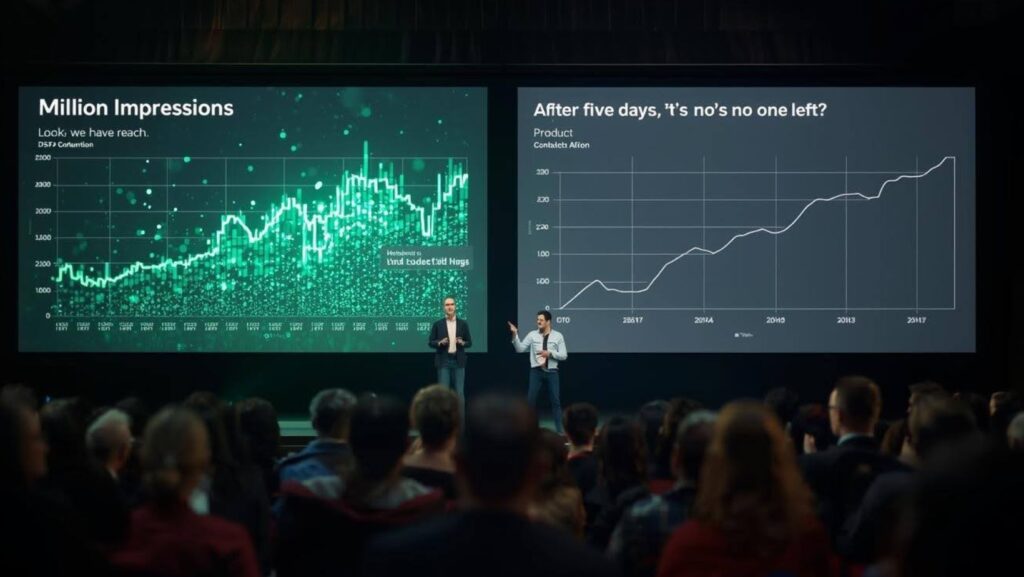
In the experience of SmartyAds analysts, this scenario occurs regularly. The CTO shows the retention curve: “People drop off on the 5th day.” The CMO immediately opens the DSP report: “But look, we have 100,000 unique contacts per week.”
They are both right. And they both speak different languages.
This is a systemic disconnect:
- Technical barrier. Data from demand-side platforms (DSP) lives in closed ecosystems. APIs are limited, formats are incompatible, and updates arrive later than the product needs them. As a result, marketing sees the click, but the product only sees the purchase, and there is a gap between them.
- Organizational barrier. Marketing does not share raw logs: “too noisy, too difficult.” The product says, “we don’t need it right now.” And so it goes on for months, until retention fails and there is no one to blame.
- Mental barrier. Different coordinate systems. One team believes in coverage and reach, the other lives by retention metrics. They argue about who is “more important” instead of asking: what does the customer really remember?
On demo day, it looks almost painful: the graph with a million views is sparkling, but the repeat visits line is dead. The investor asks, “Who came back for a second time?” and there is no answer. This is not a bug, but a diagnosis: money is going to acquisition, retention is failing.
A skeptic would say, “Well, that’s always the case.” But this is where the business is losing out. There is no bridge between the initial click and real loyalty.
What remains? Old, unfashionable practices: interviews, surveys, cohort analysis, even in Excel. They capture what no demand-side platform can provide: memory, motive, reason for return. And this knowledge is often enough to save a product from the chronic fatigue of two parallel truths: “there was contact” and “the customer is gone.”
The Bridge Between DSP And CDP
This is where real engineering begins.
If DSP data is fed into a CDP (Customer Data Platform) and from there into product analytics, the most frustrating gap disappears: the gap between acquisition and retention.
The CDP collects user profiles from various sources — advertising, websites, products. Now you can see that the same person who saw three banners registered and stayed with the product for a second month.
The table looks something like this:
| Data source | Recorded event | Metrics for analysis |
| DSP | 3 advertising contacts | Impression log (ID:123) |
| Product | Registration, retention 30 days | Retention cohort (ID:123) |
It becomes clear that these are not two different “customers.” It is the same user; you just saw half the picture before.

Yes, it’s expensive. Yes, integration requires pipelines, ETL, and API work. But consider the cost of ignorance: millions spent on acquisition without understanding who actually stays. For large companies, where budgets for demand-side platforms are in the hundreds of thousands, a mistake of scale is a disaster.
As practitioners at SmartyAds often note, the hardest part isn’t technical ETL pipelines, but the cultural shift: convincing marketing and product to treat the same user as a single story, not two disconnected metrics.
Conclusion
And here’s the main question. How much longer are you willing to put up with asymmetry — when someone else’s advertising platform knows more about your customer than your own product?
Some might say, “Well, it’s okay, because we’re growing in terms of impressions.” But that’s the trap: growth in terms of graphs ≠ business growth. It’s like a company where the servers are working, but customers aren’t logging in.
Three doubts:
- “What if integration doesn’t work?” → “Then at least you’ll find out where you’re losing customers.”
- “But DSP already shows a lot” → “That’s enough for advertising, but not enough for the product.”
- “Everyone does it” → “That’s why those who do things differently have an advantage.”
And the solution here is not another “analytics panel.” It is in building a bridge between acquisition and retention: linking DSP data with product analytics, even if it’s through manual cohort tables, API integrations, or user interviews.
And then it’s your choice. Compare the product map with what demand-side platforms already know. If they match, great, you have a solid foundation. If not, you now have a plan for where to start.