Price charts are invaluable tools for cryptocurrency traders. They provide visual representations of historical price movements and trends. Understanding how to effectively interpret and utilise these charts can significantly enhance trading decisions. This article explores the advantages of using price charts in crypto trading and highlights their importance in strategy development and decision-making.
Visual Representation of Market Data
Price charts offer traders a visual representation of market data, allowing them to analyse historical price movements over different timeframes. By plotting price data in graphical form, charts enable traders to identify patterns, trends, and key levels of support and resistance. For instance, a Bitcoin chart may show price fluctuations over the past month, helping traders spot trends or potential reversal points.
Timeframe Selection and Granularity
Price charts allow traders to choose different timeframes and granularities based on their trading strategies. Whether analysing short-term price movements or long-term trends, charts can be adjusted to show hourly, daily, weekly, or monthly data. Short-term traders may focus on intraday charts to capture quick price movements, while long-term investors may prefer weekly or monthly charts to identify broader trends and market cycles.
Identifying Support and Resistance Levels
Support and resistance levels are imperative concepts in technical analysis, and price charts help traders identify these levels visually. Support levels represent price points where a downtrend is expected to pause or reverse, while resistance levels indicate where an uptrend may encounter selling pressure. By analysing historical price movements on charts, traders can pinpoint key support and resistance levels that may influence future price action in cryptocurrencies like Bitcoin.
Analysing Market Trends
Price charts provide insights into market trends, helping traders understand price movements’ prevailing sentiment and direction.
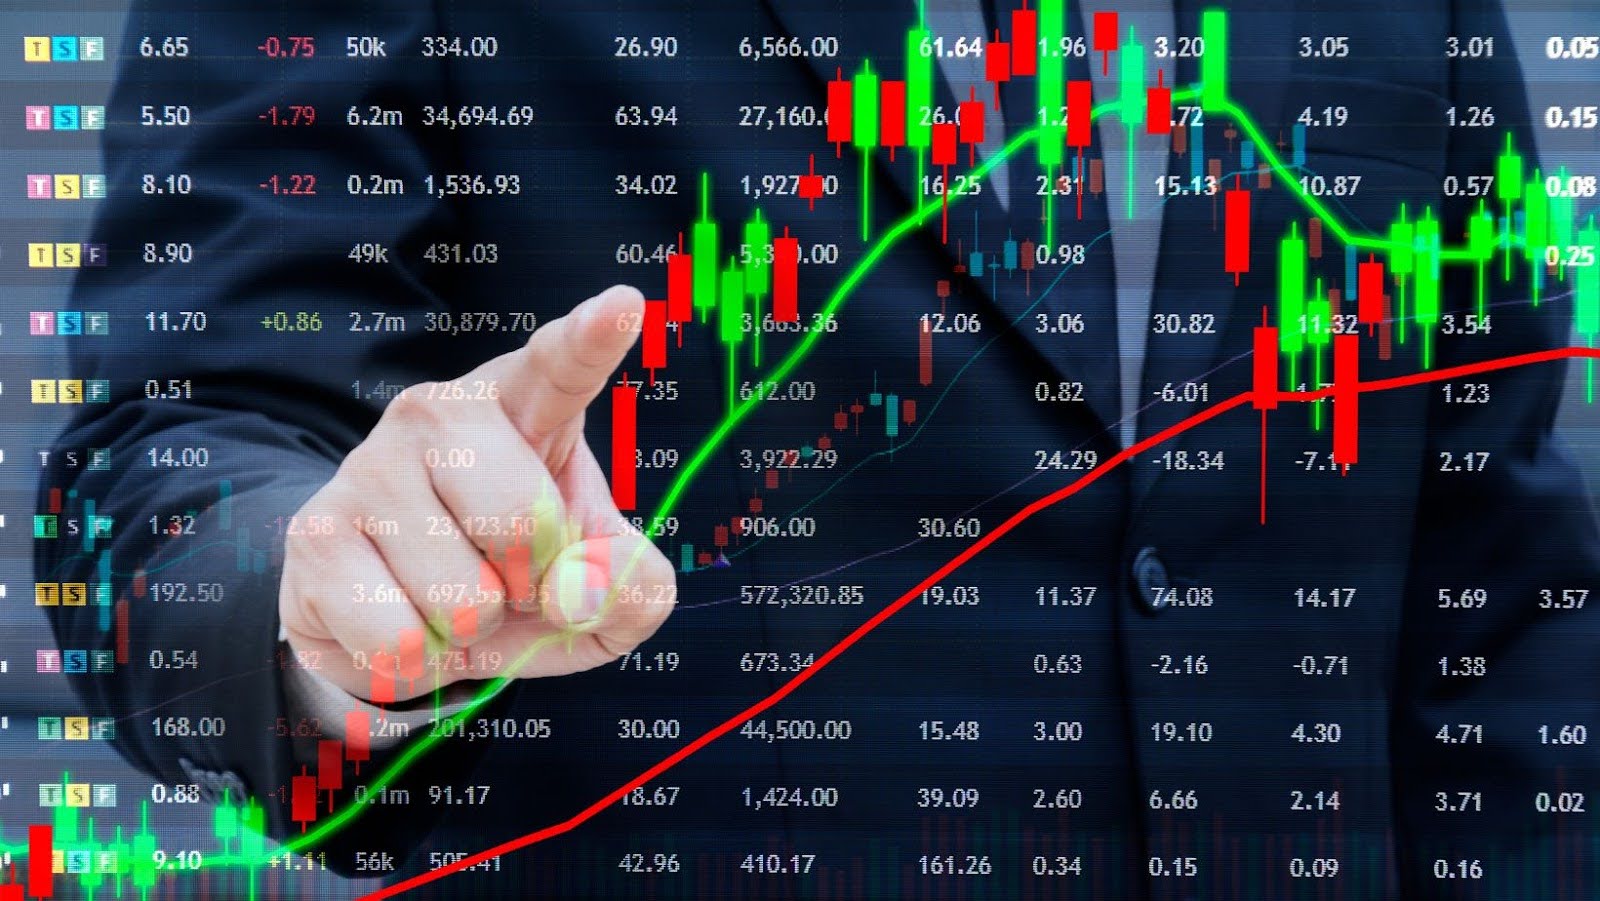
Trendlines drawn on charts can illustrate the direction of price movement, whether bullish (upward) or bearish (downward). Recognising trends early allows traders to align their strategies accordingly, whether it involves trend-following or contrarian approaches.
Monitoring Price Volatility
Volatility is an imperative factor in cryptocurrency trading, and price charts help traders monitor volatility levels over time. Dogs coin price has seen significant fluctuations in recent months, making it a particularly interesting case study for analyzing volatility patterns and potential trading strategies. Candlestick charts, for example, display price volatility within each candle, showing the range between the high and low prices during a specific period. Understanding volatility patterns can assist traders in adjusting their risk management strategies and position sizing based on market conditions.
Decision-Making and Timing Entries/Exits
Effective use of price charts facilitates better decision-making when entering or exiting trades. Traders can use technical analysis tools and chart patterns to time their entries and exit effectively. For instance, a trader might wait for a bullish breakout above a resistance level on a price chart before entering a long position in Bitcoin.
Conversely, they may consider selling if a chart pattern indicates a potential price reversal or bearish divergence.
Accessibility and Real-Time Updates
With technological advancements, price charts are now widely accessible through trading platforms and financial websites, providing real-time updates and analysis tools. Traders can access charts on desktops, tablets, and smartphones to monitor market conditions and make informed decisions from anywhere. Real-time charting allows traders to react swiftly to market developments and capitalise on trading opportunities.
Utilising price charts, for instance, a Bitcoin chart, in crypto trading offers numerous advantages, including a visual representation of market data, technical analysis for trading strategies, identification of support and resistance levels, analysis of market trends, monitoring price volatility, decision-making for entries and exits, backtesting for strategy development, and accessibility for real-time updates. By leveraging these benefits, traders can enhance their understanding of market dynamics, improve their trading precision, and ultimately strive towards achieving their investment goals in the cryptocurrency market.